
Explanation how I worked out the 2020 excess mortality for European countries.
Getting the data
We are going to be using data from Eurostat. This gives us measures that are consistent between countries. The weekly mortality data is according to ISO week dates. This means that the ISO week years 2015 and 2020 are 53 weeks, 371 days, long, while other years we'll be looking at are 52 weeks, 364 days, long. This means that even if the mortality rate for a country remained the same between 2019 and 2020, using ISO week years, 2020 will appear to have had 2% excess mortality. Comparing to the average of the preceding five years would, however, only result in 0.4% excess mortality. Given that my calculations give the same excess mortality result as the Slovak Statistics office reports for Slovakia, it would seem no attempt is made to correct for these differences. For the sake of making comparisons, it doesn't matter.
Listing of data tables on Eurostat. The data we are interested in is Population on 1 January by age and sex (demo_pjan) and Deaths by week and sex (demo_r_mwk_ts) There are options to download this data into different formats, and also to select different subsets. Among the advanced options is the possibility to export without "flags", which makes the data easier to work with. Some of these figures are provisional, however, at this point in time, week 8 of 2021, according to the explanatory texts on the mortality table, accuracy for the weeks we are looking at, all in 2020, should be nearly 100% for all countries. Some countries have not, however, reported all weeks. Romania is missing week 53, while both Greece and Italy lack the last four weeks and the UK the last two at the time of writing this (22. Feb. 2021).
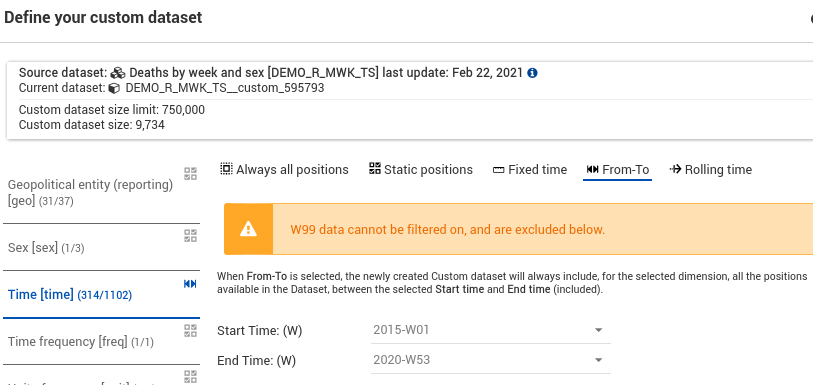
Clicking the + on the blue bar labelled "Time" on the mortality table brings up "Define your custom dataset". I dropped the last 6 "Geopolitical entities" as they don't have up to date data at all. For "Time" there is a "From-To" option, and I want from 2015-W01 to 2021-W01. See the screenshot. Make sure that the resulting data table includes YYYY-W99 -- these are deaths in Sweden that weren't assigned a day of death. For "Sex", selected just "Total". Then just download the data in the format you want, take the "Full Dataset", setting "Flags" to "Without Flags", Labelling "Codes", and empty cells to be blank. Similar deal with the population table.
Working with the data
Shamefully, I don't know how to use Python for data analysis. It would make this a quick exercise and make recalculating with new data far easier. Soon... For now, I will be using LibreOffice Calc, any spreadsheet program should work fine.
Opening the mortality data, insert a column after each YYYY-W99. In the cells of that column, take the sum of all of the weeks for that year. One little problem with Germany, there is no 2015 mortality data by week, so I grabbed the number from another Eurostat table of monthly mortality -- the annual values in this table differ from the ISO week year totals, though not by much. Perhaps it would be fine to grab all of the mortality data for years 2015-2019 from these tables, for comparing between countries, it should be legitimate. Copy the names of the countries and columns with the sums into another spreadsheet, leaving two columns between them.
From population data, you need to get rid of Ireland, as there was no weekly mortality data for it, and then it should be a simple matter to copy those yearly columns next to the yearly columns of death data in the spreadsheet. Then calculate a death rate, which I am doing "per million" since that is how COVID death rate is usually reported. Formula is DEATHS / (POPULATION / 1E6) Finally, another column can be added, using the AVERAGE function to average the preceding five years. Then % difference can be found.
A zipfile with the two source tables (and these modifications already done) and a spreadsheet with results is available here.
- Log in to post comments